Allianz UK Listed Equity Income C Acc
Allianz UK Listed Equity Income C Acc
ISIN:
GB00BP5X3981
Risk level:
FE fundinfo Rating:
3 of 5
IA Sector:
IA UK Equity Income
Income type:
Accumulation
Price:
109.2500GBX
18 April 2024
Last change:
icon-up-small 0.16%
1 year change:
icon-down-small -0.31%
5 year annualised return:
N/A%
12 month yield:
0.00%
At a glance performance and information
Eligibility:
The value of investments, and income from them, can rise and fall so you may get back less than you invest. If you are unsure about investing, seek independent advice
Add to chart:
-
Allianz UK Listed Equity Income C Acc
-
IA UK Equity Income
-
FTSE All Share
Discrete calendar year performance
Trailing returns
(*annualised)
Fund Objective: The Fund aims to generate a total return (income and capital growth) net of fees greater than that of the FTSE All-Share Index (net of fees) over a rolling 5 year period. The Fund also has a secondary objective to deliver an annual income yield greater than the FTSE All-Share Index. It does this by investing in securities listed on the London Stock Exchange, although it may invest internationally and in all economic sectors. Please see the Key Investor Information Document for objectives and investment policy.
Manager name:
Allianz Global Invtrs GmbH(UK)
Manager start date:
01 December 2023
Investment style:
*None
Region (geographical):
United Kingdom
Manager Biography:
Andrew joined LGIM in August 2014 and is a senior portfolio manager responsible for the active equity income strategies. He read Philosophy, Politics and Economics at New College, Oxford. Andrew is a CFA charter holder, and an ASIP
Benchmark:
FTSE All Share
Sector:
IA UK Equity Income
FE fundinfo Rating:
3 of 5
Fees and Charges
*This is an indication based on the market average. The fund’s actual transaction cost will be shown before you place a trade.
Account charges are not included
Asset Allocation
Fund size: 271,521,379.71 GBX
Chart date: April 18, 2024
Top 10 Holdings
Sectors
World regions
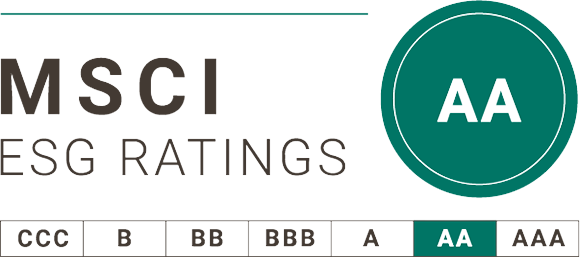
What is ESG?
ESG stands for Environmental, Social and Governance and is an approach for evaluating to what extent a company works towards social goals. For investors this can be used in order to understand how their funds and the assets they are made up of work towards these goals and use that information to help make sustainable investment choices.
ESG Metric
Score
MSCI ESG Quality Score (0-10)
7.7
MSCI ESG Quality Score - Peer Percentile (0-100)
23%
MSCI ESG Quality Score - Global Percentile (0-100)
93%
Fund Environmental Impact Involvement (%)
24%
Fund Social Score Impact Involvement (%)
5%
Fund Severe Governance Controversies Involvement (%)
8%