Artemis SmartGARP Global Equity I Acc
Artemis SmartGARP Global Equity I Acc
ISIN:
GB00B2PLJP95
Risk level:
FE fundinfo Rating:
3 of 5
IA Sector:
IA Global
Income type:
Accumulation
Price:
439.1500GBX
19 April 2024
Last change:
icon-down-small -0.20%
1 year change:
icon-up-small 14.24%
5 year annualised return:
8.41%
12 month yield:
2.44%
At a glance performance and information
Eligibility:
The value of investments, and income from them, can rise and fall so you may get back less than you invest. If you are unsure about investing, seek independent advice
Add to chart:
-
Artemis SmartGARP Global Equity I Acc
-
IA Global
-
MSCI ACWI
Discrete calendar year performance
Trailing returns
(*annualised)
Fund Objective: To grow capital over a five year period.
Manager name:
Artemis Fund Managers Limited
Manager start date:
01 January 2004
Investment style:
Growth
Region (geographical):
Global
Manager Biography:
Peter has managed Artemis’ ‘global equity’ strategy and an institutional global equity fund since January 2004. Peter has also co-managed Artemis’ ‘european equity’ strategy since December 2002, and Artemis’ ‘global emerging markets equity’ strategy since its launch in April 2015. He joined Artemis in December 2002 from Merrill Lynch, where he worked as an equity strategist from 1999. Peter holds a BA in mathematics & philosophy from the University of Oxford, an MA in economics from Freiburg University and a PhD in economics from Hamburg University. He is a CFA charterholder, a partner in Artemis and a member of the executive committee.
Benchmark:
MSCI ACWI
Sector:
IA Global
FE fundinfo Rating:
3 of 5
Fees and Charges
*This is an indication based on the market average. The fund’s actual transaction cost will be shown before you place a trade.
Account charges are not included
Asset Allocation
Fund size: 517,958,376.94 GBX
Chart date: April 19, 2024
Top 10 Holdings
Sectors
World regions
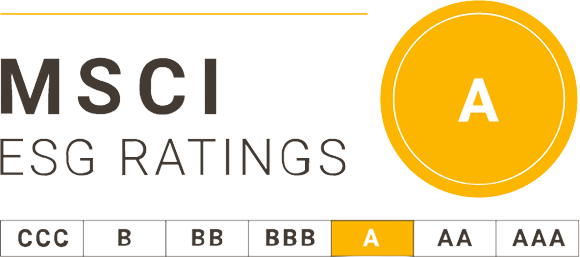
What is ESG?
ESG stands for Environmental, Social and Governance and is an approach for evaluating to what extent a company works towards social goals. For investors this can be used in order to understand how their funds and the assets they are made up of work towards these goals and use that information to help make sustainable investment choices.
ESG Metric
Score
MSCI ESG Quality Score (0-10)
6.4
MSCI ESG Quality Score - Peer Percentile (0-100)
14%
MSCI ESG Quality Score - Global Percentile (0-100)
47%
Fund Environmental Impact Involvement (%)
12%
Fund Social Score Impact Involvement (%)
5%
Fund Severe Governance Controversies Involvement (%)
14%